Data Analyser Basics
Create, and apply filters to, univariate and bivariate charts
Maptek Data System
Maptek Compute Framework
Maptek Orchestration Environment
Join our early access program to unlock value for your organisation.
Drill & blast management
Scheduling and haulage scenarios
Reliable proximity awareness underground
Dynamic survey surface updates
Mine planning & geological modelling
Connected geological modelling solution
Machine learning assisted domain modelling
Material tracking & reconciliation systems
Laser scanning & imaging
Point cloud processing & analysis
LiDAR-based stability & convergence monitoring
Derive value from airborne or mobile sensor data

Create, and apply filters to, univariate and bivariate charts
Register now in the Maptek Users Area
Don’t have access to the Users Area?
Contact us
to learn about alternate access and other distance learning options.
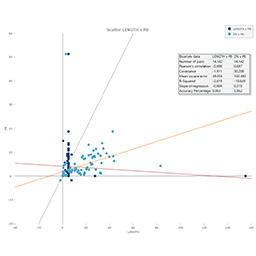
Learn how to create professional statistical charts with Data Analyser. Easily generate univariate and bivariate charts to quickly understand your data. Create custom filters, groups, and domains to isolate your statistical analysis. Visually correlate data on your statistical chart with points or centroids loaded in Vulcan.
Create custom groups and filters for cleaner and more useful charts.
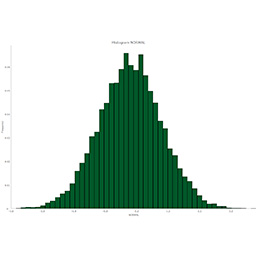
Generate charts that visually represent data in fields and block model variables.
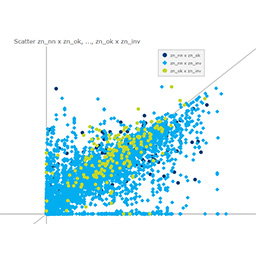
Visualise the relationship between two data sets with bivariate statistics.
Register for Data Analyser Basics to dig deeper into your deposit with statistical analysis and intuitive charts.
You should take this course if you:
This course is best suited for geologists and mining engineers.
We use cookies to enhance your browsing experience and analyse our traffic. By clicking "Accept all", you consent to our use of cookies. You can customise your cookie preferences by clicking 'Customise Preferences'.
We use cookies to enhance your browsing experience and analyse our traffic.
Our website may store cookies on your computer in order to improve and customise your future visits to the website. By using cookies, we can track information about your usage of the site and improve your experience with anonymous and aggregated user data.
Review our Privacy PolicyEssential for the website's functionality, without which the site cannot operate smoothly.
Remember user preferences and choices to provide a more personalized experience.
Collect data on how users interact with the website, helping to improve user experience.
Used to deliver targeted advertisements to users based on their browsing behavior and preferences.