Drill and Blast: How to speed up incident reporting using BlastLogic
If a blasting incident occurs, it’s important to find the root cause quickly, to avoid it happening again.
When a blasting incident occurs on a mine site, an investigation is usually guaranteed. Unfortunately, investigating and reporting on blasting incidents can be a manual, frustrating and time-consuming process. Why? And crucially, what can we do to speed up incident reporting? Using Maptek BlastLogic, our enterprise drill and blast software, we’re going to show you 3 steps to speed up your incident reporting from days and weeks, to minutes or hours.
Three steps to faster and better mine incident investigations
- Keep all your data in one place
- Create a workflow for you and your team to follow
- Use visual and graphical tools to gain quick insights
NB: This article is a breakdown of our webinar Incident Management with BlastLogic. In the webinar, we go into greater depth, so if you’d like to learn more about how to investigate blast incidents in BlastLogic, it’s well worth watching.
Step 1. Keep all of your data in one place
At the beginning, blast incident investigations are often slowed down by critical data being hard to find. It’s common for information to be stored in numerous places, with obscure file names. In enterprise systems, such as BlastLogic, all of your data, designs and information are kept in one place. Think of BlastLogic as a well organised kitchen. All of your ingredients and utensils within easy reach.
Most of our customers use a combination of the following data sources, all of which can be imported or accessed via Blastlogic:
Field data – location of the incident. This may include GPS and survey data
Design packages – drill design, tie up design, loading or even vibration control
Paper records – blast report, explosives loading or measurements down the hole
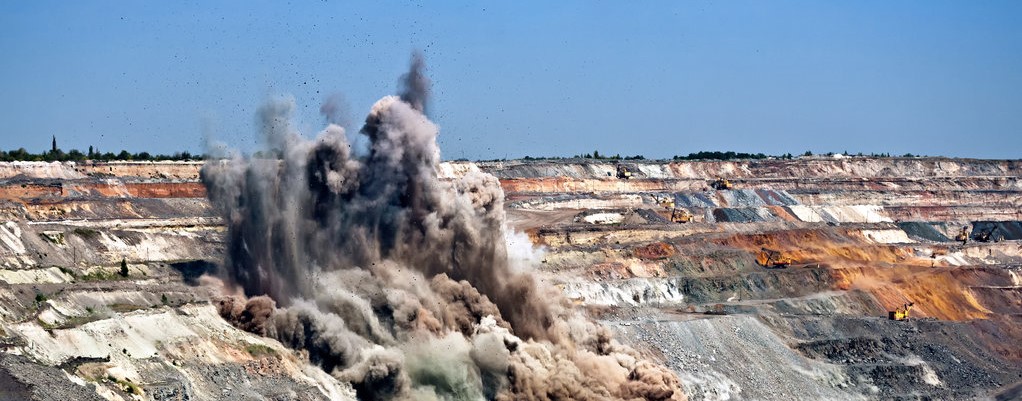
Pictures – video or images can be helpful in identifying the cause. Investigations often start here
Database – usually some, but not necessarily all of the above will be stored in some kind of database – often in Excel
Step 2. Create a workflow for you and your team to follow
Most mine sites will have a formalised process for investigating/reporting on blasting processes. In BlastLogic you can replicate this process using the Workflow Management Tool.
Here’s an example of a typical workflow:
- Locate the incident and find all the drillholes in the area.
- Review holes for information such as – actual hole location, water, design, drill location, drill depth, loading depth, choice of explosives.
- Post blast reports – misfires, charge summaries, powder factors, shot fire, post blast performance and even inventory usage.
- Individual hole analysis – focus on those holes that had issues. Look for common traits or differences from other holes.
- Review pictures/video – review pictures and videos of the blast. Look at volumes of the shots and even vibration tracers.
- Timing – in combination with the above, analyse how timing may have affected the incident area.
- Summarise your information and communicate findings.
Step 3. Use visual and graphical tools to gain quick insights
A blasting incident may be the result of individual or combined factors. Graphical and visual tools in BlastLogic help us to make sense of big data; to pinpoint the factors behind good or bad performance. At each step of the blasting process, BlastLogic gives you the ability to query your data and to identify what’s going on.
To demonstrate, we’re going to open up BlastLogic and show you a typical process we would use to investigate an incident resulting from blasting.
Our example incident
We’re working in a large open pit mine and have had complaints about hard-digging in the pit which has resulted in equipment damage. Let’s start our investigation.
1. Locate the incident
Our surveyor has sent us survey data from the spot where the incident happened, which we upload into BlastLogic (below). We already have our drillhole data in the system, so we take a quick look at the drillholes located in the area of concern.
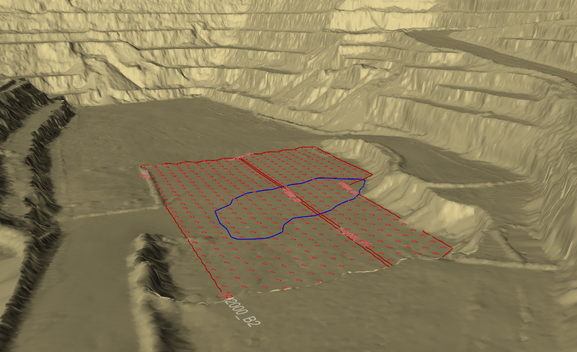
Survey data helps us to locate the incident
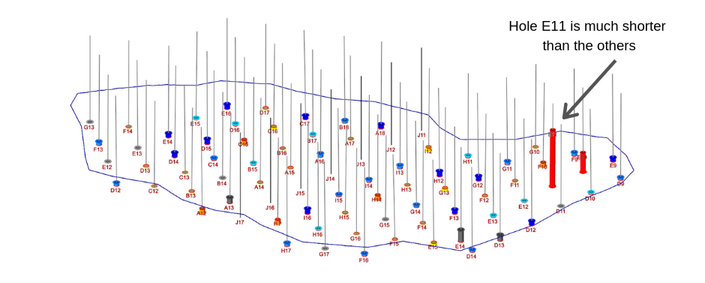
We notice immediately that one hole is much shorter than the others (see below). In the next step, we’ll attempt to find out why.
2. Identify and analyse problem holes
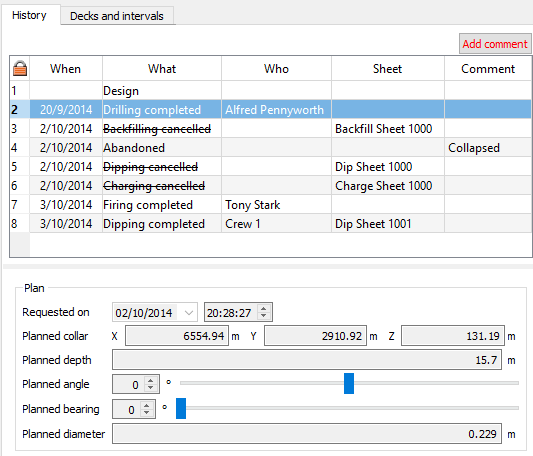
We’ve identified at least one hole that is much shorter than the others. Our hole history (see image below) tells us that the hole collapsed and was abandoned according to crews that went out on that day.
We also find that the hole E11 was designed to be drilled to 15.7m, but was actually only drilled to 4.2m.
3. Review drillhole information to identify concerns
At this stage it’s too early to tell what has happened. However, we have noticed that the size of the polygon is rather large. A closer look at the drillholes tells us that our polygon is made up of two different blasts, B5 and B2. Interesting, but it doesn’t reveal an awful lot at this stage. Let’s keep investigating.
Water down the hole
Nothing much to see here (see below).
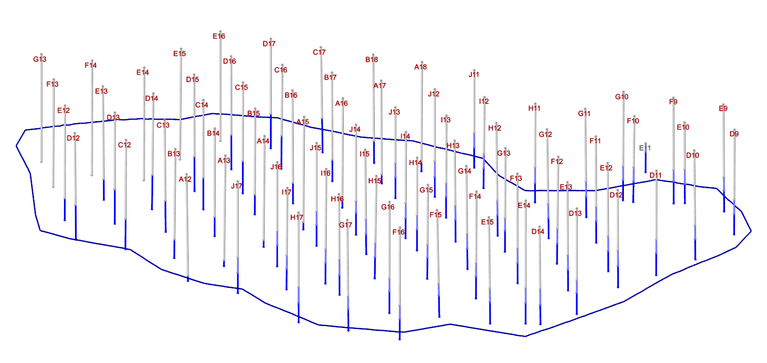
Charge depth variation
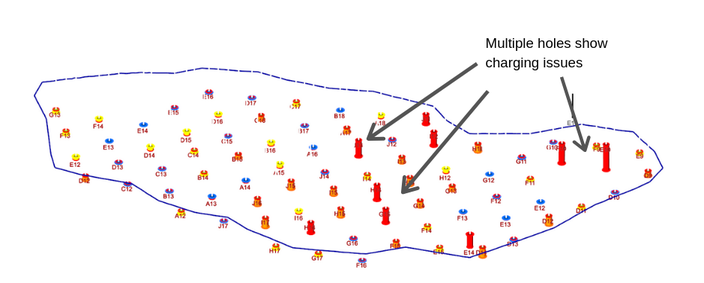
Studying our charge depth variation, we can see that our two original problem holes still present an issue. However, a few holes in the middle have also been backfilled too far, or another issue has resulted in them not being loaded deep enough. Perhaps fallback?
Explosives loading
Taking a look at explosives loading, we’re surprised to see that roughly half of the holes have been loaded with ANFO, and half with other types of emulsions.
- ANFO is red
- Emulsions are purples/pinks
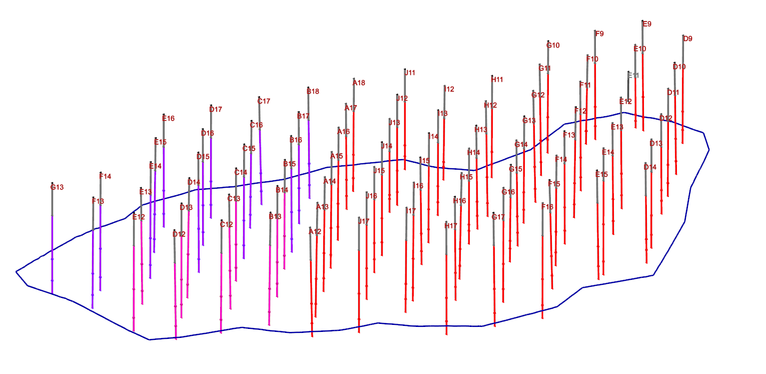
Curiously, in some holes both types of explosives were used. Why? Furthermore, why was ANFO loaded into holes that had water in them? We suspect that the correct drillhole design wasn’t communicated to the drilling/blasting team, maybe as a result of a lack of time.
4. What have we learned so far?
In just a few minutes, BlastLogic has revealed that the right side of our polygon definitely had some kind of issue.
- Our polygon is made up of two blasts, B5 and B2
- A few holes weren’t drilled or loaded properly, which has resulted in over backfilling or fallback
- ANFO was loaded into holes which had water in them, which is an inappropriate explosive for this type of hole
We’re going to continue through our workflow and take a look at our blast summary reports.
5. Let’s check our blast summary reports
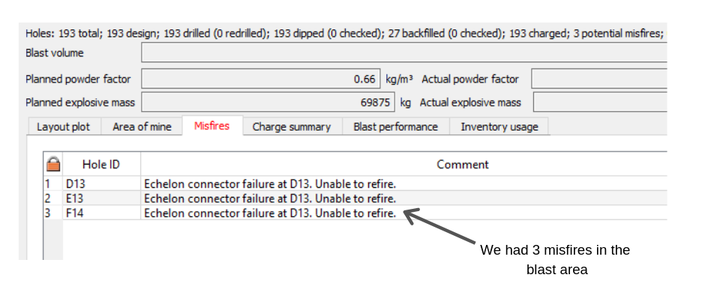
In BlastLogic, the Blast Summary Reports reveal a wealth of information, such as drilling information and shots fired, powder factor, explosives loading and much more besides. Right, now we want to know about any misfires.
Starting with the B5 blast our report tells us that there were 3 misfires, which indicates that there was a pretty big problem.
Digging further, the charge summary tells us exactly which materials were used in our blasts, including explosives, down-hole, boosters, and stemming as well.
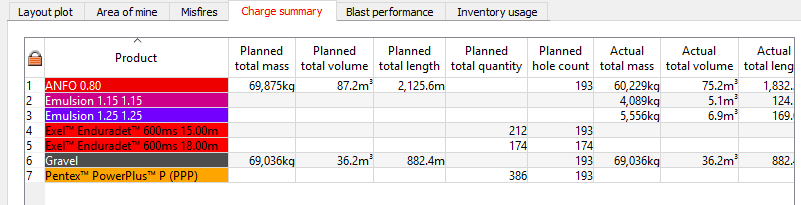
We’re surprised to see ANFO loaded into a hole where there’s water
We’d look to query this information a little further as we were surprised at the choice of ANFO being utilised down some of the holes.
Repeating the process for the B2 holes, we discover that there was another misfire. Four misfires in total would help to explain why we had hard digging in this area of the mine.
Summary of our blast incident investigation: done in 15 minutes
In the webinar we take a look at further blast data and information, such as images of the blast, blast volume data, blast performance gauges, over-pressure etc…but we’re satisfied that we already have sufficient information to wrap up our incident investigation.
In 15 minutes, we have concluded that the hard-digging which led to our equipment damage was caused by the following issues:
- Two holes on the right of our polygon weren’t drilled to the correct depth
- There was a misfire along with loading issues in the middle of our polygon
- Certain holes were loaded with explosives that didn’t suit the rock conditions
- And finally, on the left we have misfires in a row of 3
In total, these factors would certainly have resulted in an area of hard-digging, not to mention the hazards of loading in an area with misfires.
In conclusion, having the ability to access and query all of our important blasting data in one place, means that we can quickly understand the factors behind blast incidents. But most importantly, we can act more quickly to avoid similar incidents happening in the future. As always, in mining safety should come first.
Interested in learning more about BlastLogic? Find out why real-time data is vital to your drill and blast operations.