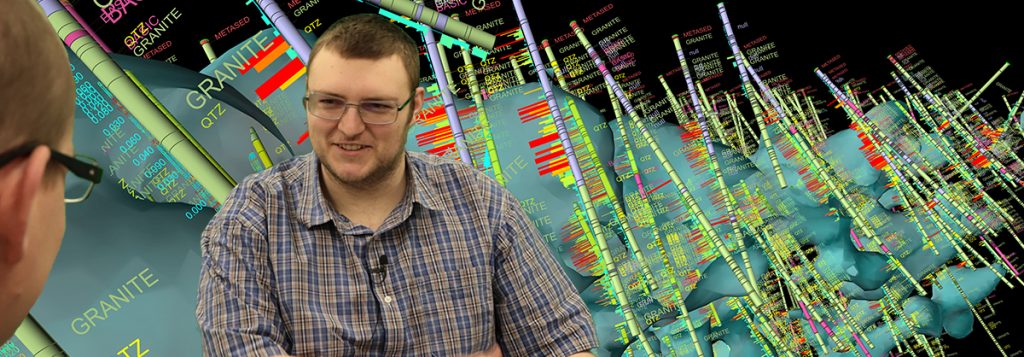
Efficient and custom 3D visualisations are the key to analyse and understand large and complex spatial data.

One of the core underlying technologies utilised by a range of Maptek applications is the 3D viewer. It provides a way of visualising a wide range of spatial data in a three dimensional space. This includes for example, PointStudio which has a key application of viewing the data returned by our laser scanners.
This allows the results of what has been captured in the real world to be displayed in the application’s 3D view and the manipulation of the camera to intuitively look around the space. This data would be impossible to understand looking at the numbers alone. However, in this way we can tap into the advanced capacities of the human brain for processing visual information. Rather than looking at the data points individually, the entire scene can be taken in. It is critical that the system is designed to efficiently display large amounts of data while still providing a high quality user experience.
Being able to manipulate the view and investigate the scene in real time is critical for allowing the user to focus on the data, and we aim to provide this for the large data sets that customers want to work with. Unlike, for example, many video games which display large beautiful worlds, we cannot know beforehand what will be displayed and then finetune accordingly to ensure maximum performance and functionality.
Our graphics team has to develop flexible approaches that will handle all user requirements and provide a useful visualisation. We are constantly working to improve the capabilities of the viewer to facilitate the ability for application teams to leverage that power to create domain specific visualisations.
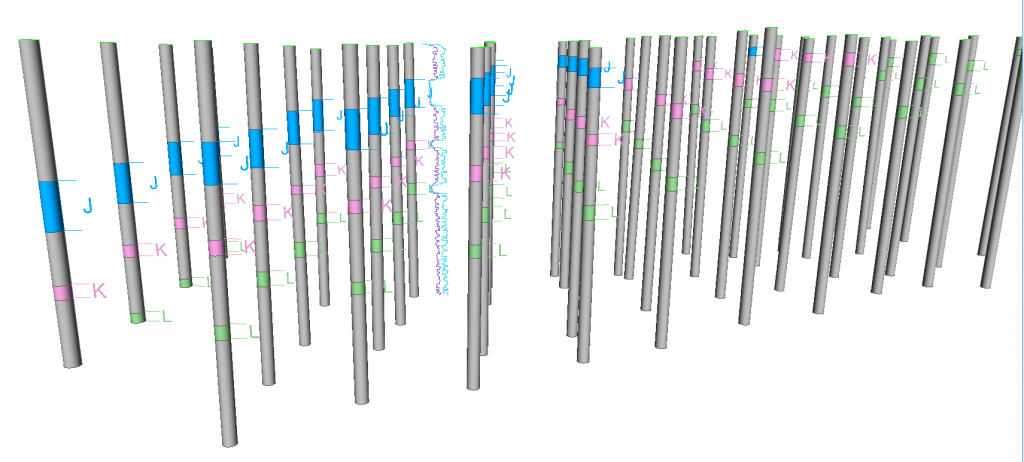
The way the results are shown can have a massive impact on how the data is interpreted. For example the drillhole correlation view in Eureka can dynamically move the drillholes in order to position them side by side and highlight the connected seams across the holes. Often by carefully curating what parts of the data are shown, at what part of the workflow, and in what manner (colour, positioning or size), the data can be optimised for effectively completing specific tasks.

Maptek Eureka Standard Viewer
The graphics team plays an important role in continuing to support Maptek applications, adding new features, improving efficiency and keeping up to date with new technology to facilitate a deeper understanding of complex data.
Listen to our latest podcast.
John Stokes asked me more questions about the details and practical applications in our latest podcast.


