Generate resource report with Vulcan in 10 steps
Every successful geologist needs tools that help to ensure the job is done right – on budget and on time. Complex tasks involved in locating mineral resources and reporting can be simplified without compromising high-quality results. Very often to generate resource report, you need to find a way to utilise multiple tools which further creates compatibility issues. What’s more, manual handling and doubling up on transferring data from one tool to another leads to errors and decreased productivity.
Vulcan GeoStatModeller is an all-in-one tool for designing resource models and accurately identifying resources. Let us take you on a journey of discovery and learning to find out how you can apply this tool in your work day.
Step 1: Database validation
Vulcan GeoStatModeller can provide accurate assessment of the data available, including database management and verification.
You can validate your database with several numeric and visual checks:
- Database Definition
- Hole locations (x,y and height)
- Horizon Lists
- Check Field values within bounds
- Validation Report
Step 2: Cluster analysis
Very often, declustering is an underappreciated step in geostatistical modelling. However unbiased resources estimation and the accurate representation of uncertainty is vital for mine planning and design.
Advantages of declustering your data prior to estimation:
- Ability to identify clusters that may introduce bias
- Prevent potential to overestimate grades
- Bias can be further reduced during estimation using octant search
Step 3: Contact profile analysis
Contact profile analysis helps to identify grade distribution in proximity to domain boundaries. Two common scenarios include 1) an abrupt change in grade at a domain boundary which is termed a hard boundary and 2) a transitional change of grade across the domain boundary, known as a soft boundary. Once the contact has been identified the appropriate strategy can be applied at the estimation stage.
Step 4: Create geological domains
You can design complex domains from drillhole information to ensure the resultant model best reflects your understanding of the underlying geological data. Methods used include:
- Polygonal based design and wireframing
- Implicit modelling using kriging or radial basis functions
- Horizon based stratigraphic modelling
Step 5: Vulcan Data Analyser
Simply create statistical and variogram charts to investigate, analyse and gain a better understanding of your geological and analytical data. Data on the charts is linked to the 3D visualisation, so the spatial context of the data can be interpreted. Generate experimental variogram models which seamlessly integrate with the grade estimation process.
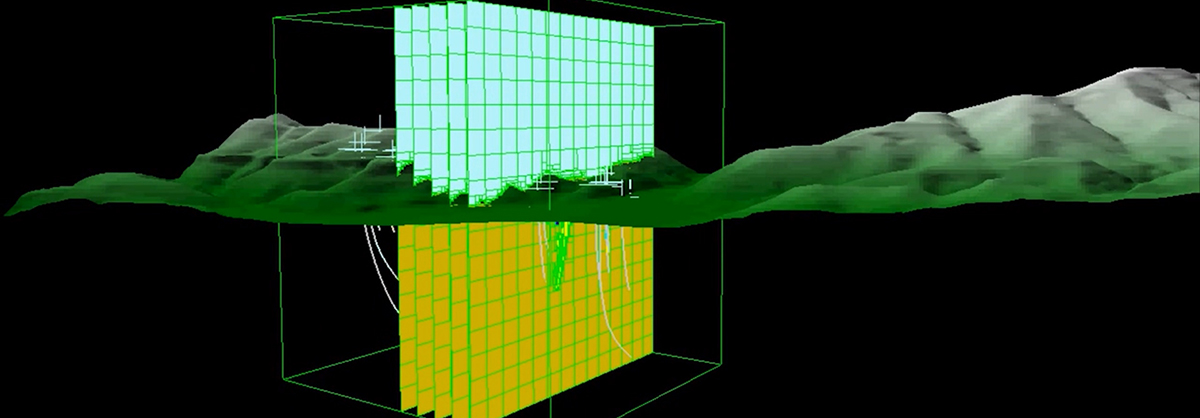
Step 6: Build block model
Create 3D models from geological domains using subblocking or HARP modelling to mimic surface models. Validate model geometry using dynamic loading and controlling views with the property editor.
Step 7: Kriging neighbourhood analysis
Kriging Neighbourhood Analysis (KNA) provides tools to minimise conditional biases during estimation. Estimation using ordinary kriging requires setting of up to 220 parameters. KNA provides justification for key settings used in the estimation process. A key tool for the competent person reporting mineral resources. Learn more about Kriging Neighbourhood Analysis optimisation
Step 8: Grade estimation
The accuracy of a resource estimation is directly linked to the quality of the geological interpretation. Grade estimation is effected for each element in each domain, often generating many tens or hundreds of estimation runs. Multithreaded processes allow running different scenarios efficiently, expediting the assessment of resource potentials. View how to display ellipsoid sample selection.
Step 9: Block model validation
Vulcan data analyser, 3D visualisation and 2D swath plots
Validation of results is an important step. Critical assessment of raw data versus derived models is required prior to sign off and reporting. Visual checks of grades in drill composites vs grade blocks is supplemented by numeric and statistical charting for quantitative analysis.
Step 10: Resource reporting
The mining industry depends on financial investments that rely significantly on resource reporting and accuracy of data. Geological in situ resource reports are the fundamental source for mine planners to add economic value and mining parameters to turn potential into a feasible mining operation. Reports can be broken down by a variety of categories such as domain, oxidation, depth to provide further understanding of grade distribution and mining potential.
A single user interface makes learning easier, resulting in better adoption and understanding of the process. Geologists can focus on geology, rather than systems integration processes. Having the ability to complete all of these steps within a single tool means Vulcan GeoStatModeller streamlines the everyday work of geologists and ensure higher quality results with less room for errors caused by transferring data between programs.
Learn more about Vulcan Geostatmodeller
Download Vulcan Brochure