How to get the most out of your borehole geophysical log

There’s no getting around it. Data is key to the success of your mine. And your data collection starts during exploration.
By collecting seemingly “ancillary” data during exploration, your mine can realise significant benefits down the road—such as increased resource model accuracy, an enhanced understanding of your deposit, and improved life-of-mine processes.
For example, your borehole geophysical log holds an immense amount of data that can deepen your understanding of your deposit. By fully utilising this data, and other exploration data, you can maximise the effectiveness of downstream operations.
A closer look at the borehole geophysical log
For anyone working in sedimentary deposits like coal or even industrial minerals, borehole geophysics are a critical part of figuring out your lithology types and seam roofs and floors.
With access to this data, you can identify material types and mineable units.
Below is an example of a canned data set for a borehole geophysical log. There are three different curves all dominated by different material types referenced on the left-hand side of the image.
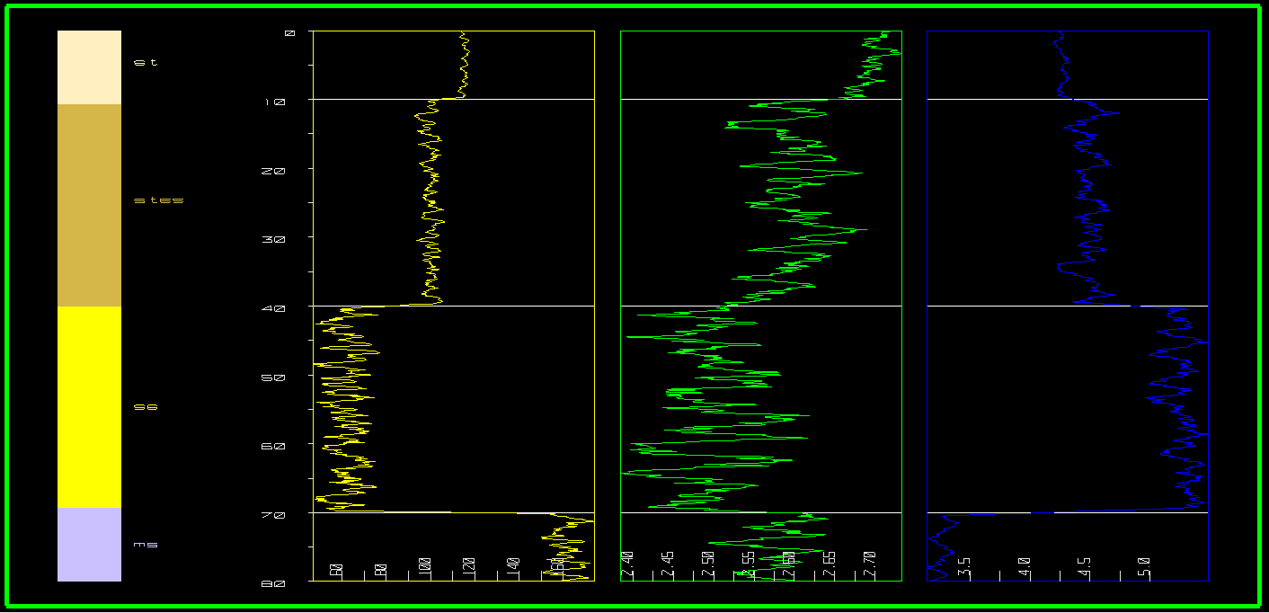
The first curve (in yellow) is your gamma curve, which is your nuclear gamma affinity. Higher gamma readings indicate higher clay content material.
The second (in green) is the density curve.
The third curve (in blue) is the resistivity curve, which helps you identify the presence of water in your drillhole.
The typical way to use this data is to primarily look at the gamma curve in relation to the density curve—as a secondary point of reference. By comparing these two curves you can make your picks for the roof or floor measurement of that unit.
While this method is great for identifying material types, it only uses about 33% of your available borehole geophysical log data. This means that almost 70% of your borehole geophysical log data is being wasted.
But this doesn’t have to be the case. You can use the additional data from these curves to help increase the accuracy of your resource model and make the most of your borehole geophysical log.
Increase density accuracy with your borehole geophysical log
As you probably know, creating an accurate resource model is key for any exploration geologist. This model is the foundation for your mine plans and schedules, and if it’s not accurate, it could negatively impact downstream activities.
One factor that can impact the accuracy of your resource model is your reserve density. Most operations will use a default density which is a perceived average density for all material types based on expensive, time-consuming lab samples. And, if you’re lucky, you’ll have maybe 10% of your holes sampled.
But, if you use the data collected for your borehole geophysical log, you’ll not only be using data you already have on hand (say goodbye to waiting for lab results!) you’ll also have samples at regular intervals with a high confidence factor.
“Why?”, you might ask. Due to nuclear regulations, the device used to measure the geophysical log is calibrated daily. This means that samples are taken every day using calibrated instruments—making it highly accurate. We have seen instances where clients collect samples at every .1 meters, giving our clients an immense amount of accurate data that benefits the entire exploration program and beyond.
Incorporating density
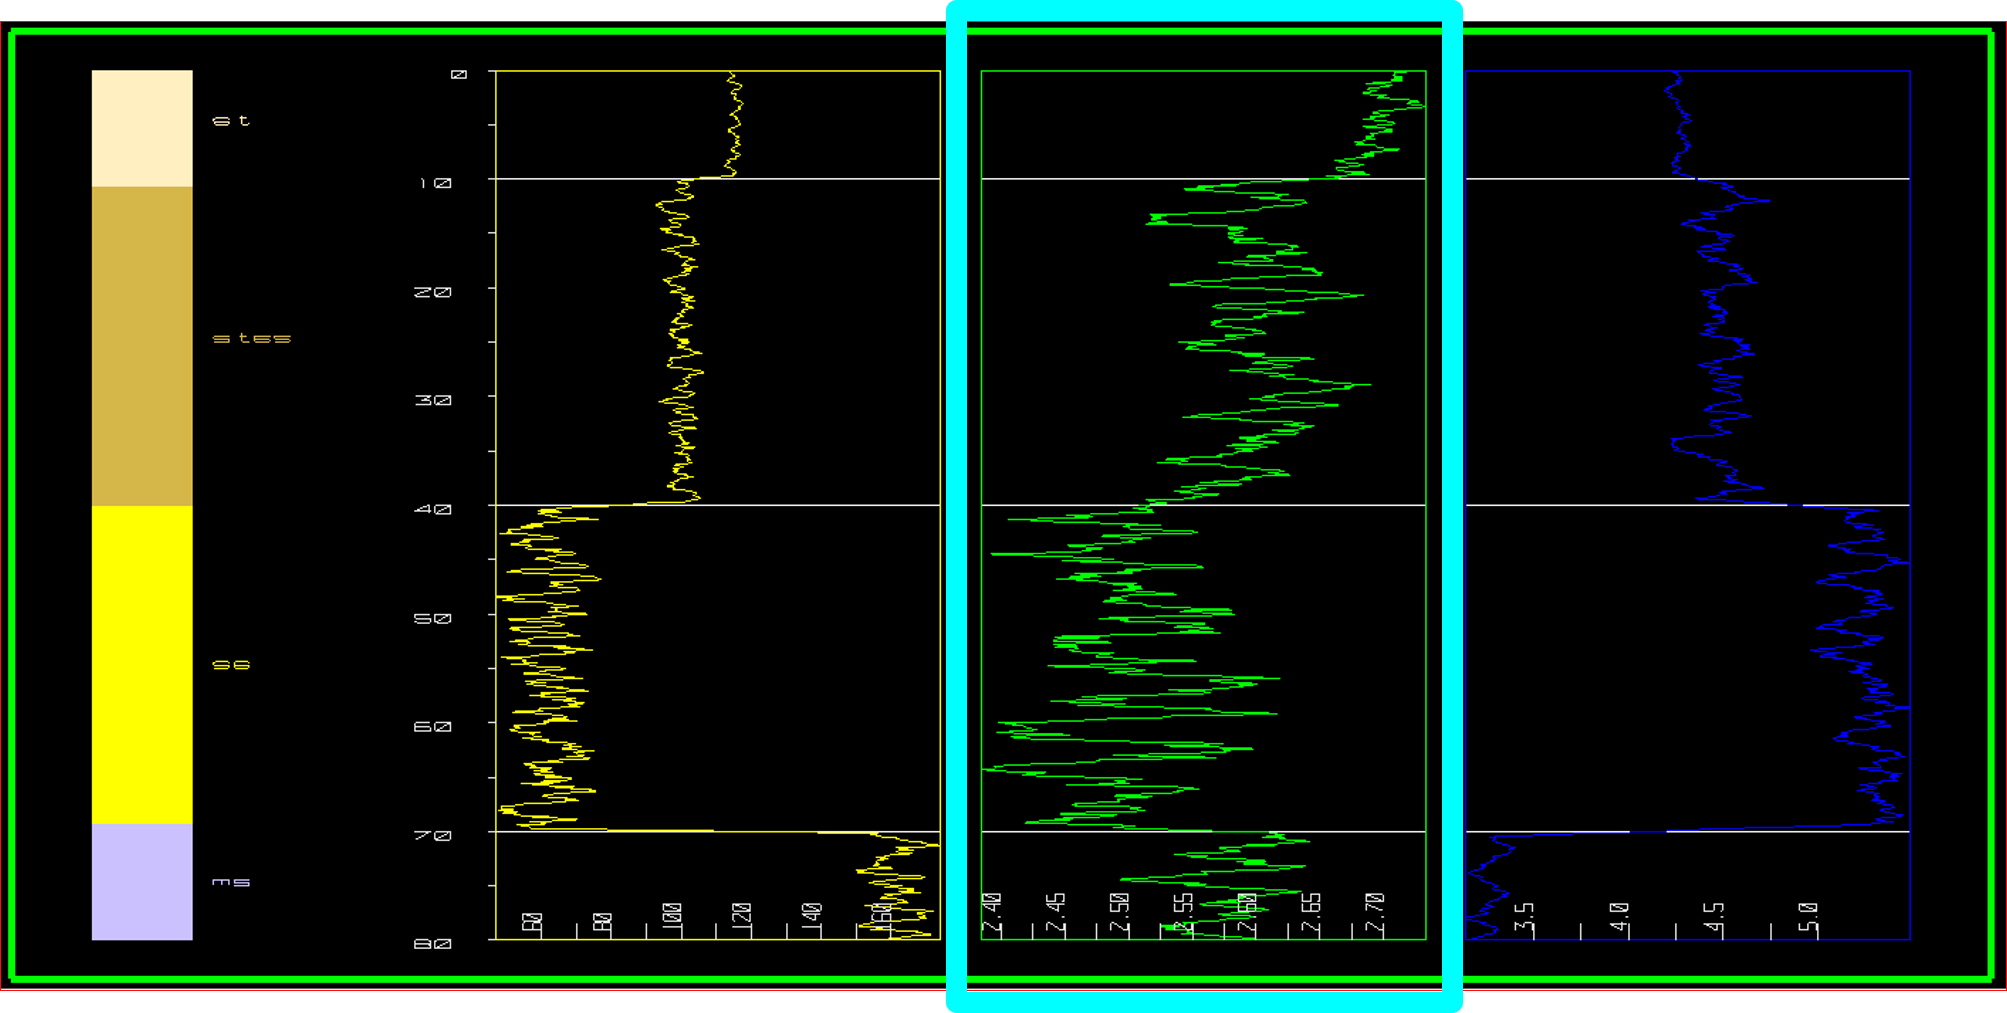
The density curve is traditionally used to only make lithology picks. But, if we take density measurements from the roof and floor picks, and create a weighted average based on the unit thickness, that value will become the borehole geophysical log unit density.
For example, let’s say we are working with a sandstone unit and the same canned data set we cited earlier. With the traditional method, you would use an average sandstone material density of 2.6 SG, but with using data from your borehole geophysical log, you would have a more accurate density of 2.49 SG (per this example).
Now, let’s take a look at how these two densities affect how we calculate reserves.
Calculating reserves
Oftentimes, when calculating reserves within a resource model, you either take density samples from a lab that originated from a number of drillholes at one given point in time or you use a blanket density.
But what if we use the more accurate density derived from our borehole geophysical log?
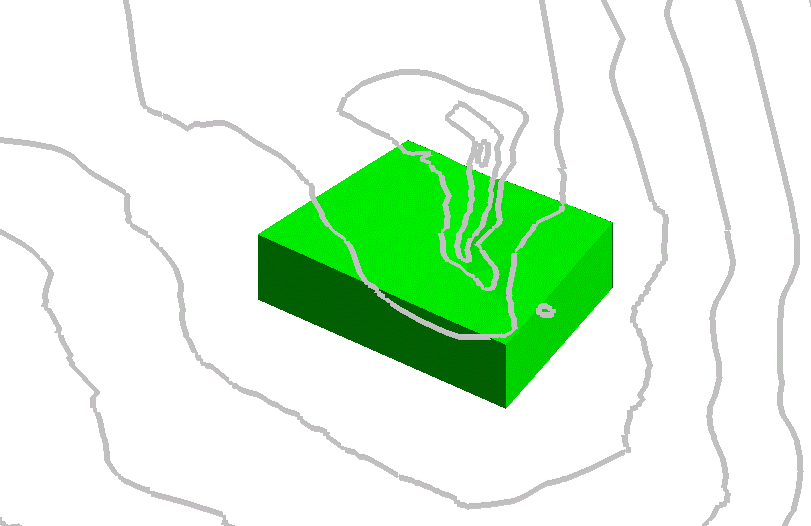
For this example, we’ll use the same reserve block, pictured below, with a volume of 18,726,411.21 m3.
Using the default/traditional density
When using a default density of 2.6 SG, and the reserve block contains a volume of 18,726,411.21 m3 and a mass of 48,688,669.1.
Using the borehole geophysical log density
When using a borehole geophysical log density density of 2.49 SG, and the reserve block contains a volume of 18,726,411.21 m3 and a mass of 46,628,763.9.
Reserve calculation result
By using the borehole geophysical log density, the calculation of your reserve mass is 4.2% more accurate.
Exploration accuracy = downstream success
While we achieved a 4.2% difference in density with a canned data set, you are likely to see a slightly different result when using your specific data.
Ideally, the difference between using a default density and your borehole geophysical log density should be 5% or less. If your difference is greater than 5% your confidence in model could be uncertain. And to help ensure you are as accurate as possible, you want to maintain a high level of confidence as this difference could be the deciding factor on whether you are within your company’s standards for tolerated difference between model tonnes and production tonnes.
If you can better forecast your reserve density, you can make better operational predictions, and more realistic plans for operation to drive downstream process efficiency and effectiveness.
So, why not start fully using your exploration data today?
Interested in learning more about how you can make the most of your exploration data? Let’s chat. Or, check out our blog on the other types of exploration data you might be missing out on.