Geology & Estimation
Add-on
Vulcan
Maptek Data System
Maptek Compute Framework
Maptek Orchestration Environment
Join our early access program to unlock value for your organisation.
Drill & blast management
Scheduling and haulage scenarios
Reliable proximity awareness underground
Dynamic survey surface updates
Mine planning & geological modelling
Connected geological modelling solution
Machine learning assisted domain modelling
Material tracking & reconciliation systems
Laser scanning & imaging
Point cloud processing & analysis
LiDAR-based stability & convergence monitoring
Derive value from airborne or mobile sensor data
Geology & Estimation Contents
Table of Contents
Related Pages
Support & Documentation
Table of Contents
Related Pages
Support & Documentation
Geology & Estimation add-on includes geology tools, and geostatistical and estimation tools for metalliferous and stratigraphic mines.
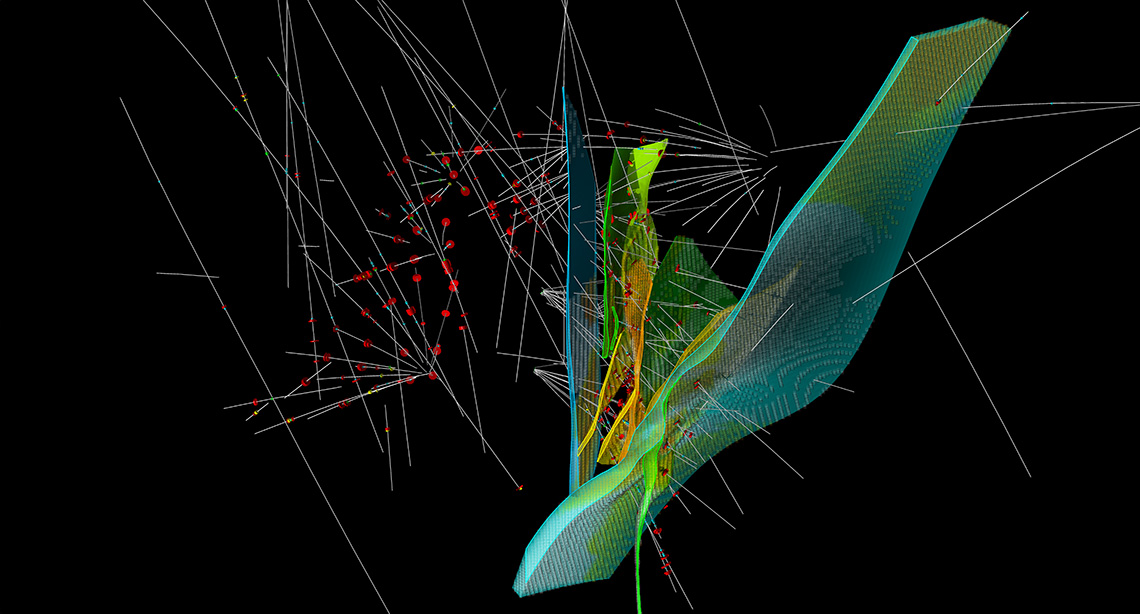
Geology tools allow users to manage and validate drillhole, geophysical, lithological and analytical data in Vulcan, or interface to third party databases.
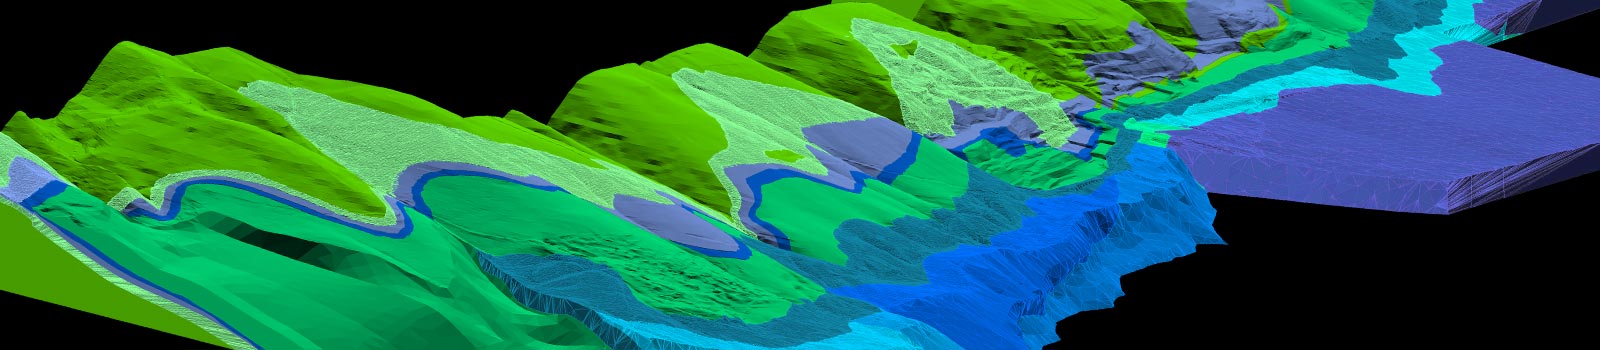
Integrated stratigraphic and implicit block modelling tools allow for repeatable, automated modelling.
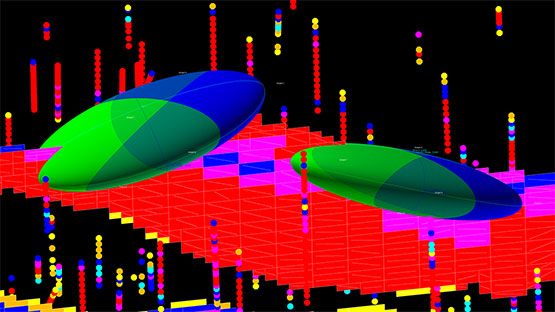
Grade estimation tools comprise inverse distance, simple kriging, ordinary kriging, indicator kriging and indicator simulation methods. Variogram modelling, analysis and reporting tools enable a better understanding of technical data with enhanced statistical, graphing and display options. High quality charts can be exported for resource reporting.
Geology & Estimation add-on provides a comprehensive set of tools for understanding and working with your geological deposits, including geostatistical tools for variography analysis and grade estimation.
ReCAPTCHA has failed to load! Try reloading the page to submit this form. ReCAPTCHA no se ha podido cargar. Intente volver a cargar la página para enviar este formulario. Não foi possível carregar ReCAPTCHA. Tente recarregar a página para enviar este formulário. Не удалось загрузить ReCAPTCHA. Попробуйте перезагрузить страницу, чтобы отправить эту форму.
We use cookies to enhance your browsing experience and analyse our traffic. By clicking "Accept all", you consent to our use of cookies. You can customise your cookie preferences by clicking 'Customise Preferences'.
We use cookies to enhance your browsing experience and analyse our traffic.
Our website may store cookies on your computer in order to improve and customise your future visits to the website. By using cookies, we can track information about your usage of the site and improve your experience with anonymous and aggregated user data.
Review our Privacy PolicyEssential for the website's functionality, without which the site cannot operate smoothly.
Remember user preferences and choices to provide a more personalized experience.
Collect data on how users interact with the website, helping to improve user experience.
Used to deliver targeted advertisements to users based on their browsing behavior and preferences.