December 2023 Issue Index
Seeing patterns in geology structures
An engineering geologist outlines the challenges of a challenging project dataset and how Maptek modelling tools were applied to control the complexity.
When Controlling Complexity was announced as the theme for the 2023 Maptek Geology Challenge, Caroline Burden was already dealing with a fascinating dataset at Jubilee Metals Ltd Croydon Project.
The initial objective of completing structural mapping snowballed into creating a geological model in what proved to be a winning move for the Engineering Geologist with GMEK.
The area had been mined since the turn of the 20th century and included an open pit that had been exposed to the elements for the past 40 years. Gold mineralisation worked from quartz veins is exposed in the current pit void.
The available drilling dataset included RC sample sets with different support lengths and limited lithology records. Records also included intersections with historic underground workings.
Dealing with 10-20m long assay intervals and highly variable lithology records was challenging enough. Adding the weathered open pit, about to re-enter production, made structural mapping even harder.
‘Previously we processed data by manually flagging drillholes with different veins, assessed the model results and repeated,’ Burden said.
Maptek DomainMCF allowed Burden to observe the 3D trends of grade distribution to visualise patterns and add subsurface thrusts and faults that align with the structural mapping. This helped to incorporate additional domains for fault blocks and folding to refine the veining in the models.
‘I could really see where those structures were possible in the subsurface. Bringing the drillholes, the ATV data with structures picked, and the mapped data together within Vulcan GeologyCore helped to refine and place the structures that inherently controlled the mineralisation,’ Burden noted.
DomainMCF also helped assess structural relationships in the subsurface. Unsurprisingly, Burden found these relationships aligned with the mapped features present, highlighting the value of structural mapping and the insights revealed for geological modelling and controlling complexity.
Mapping the numerous structures seemed chaotic at first, but it was an important starting point given that rocks are a product of the material composition and the events they’ve been subjected to.
Patterns emerge
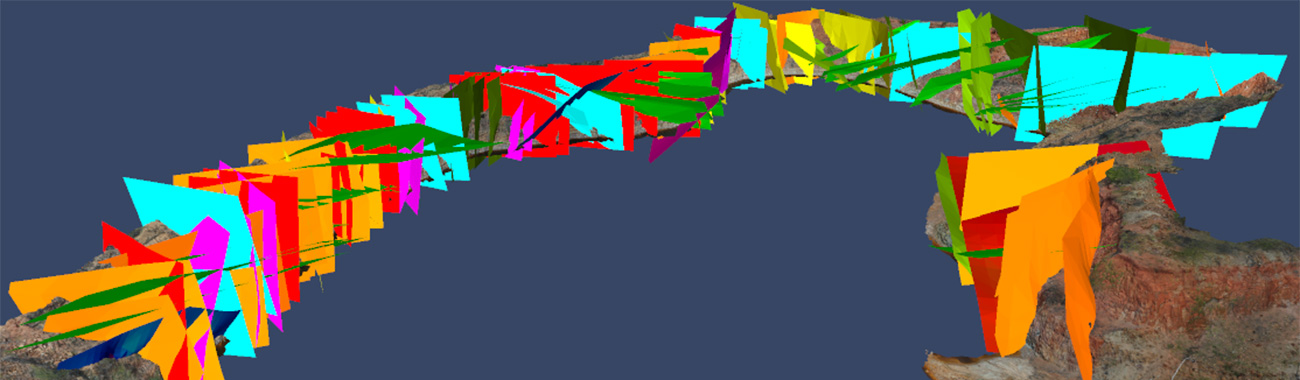
Maptek PointModeller was useful in handling registration using matching point pairs with existing ground control points on the photogrammetry-based dataset. After mapping the entire wall, patterns started to emerge.
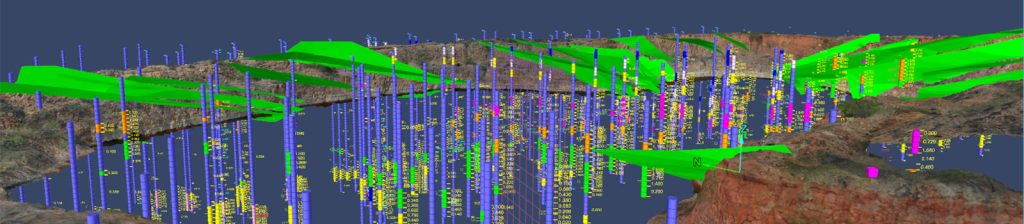
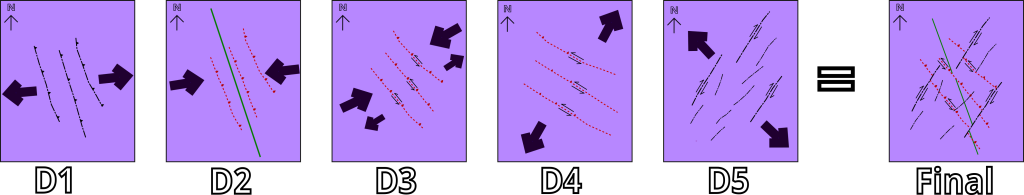
A refined view of those structures alongside the drillholes flagged by interpreted domains of regions associated with higher grade reveals how the structures influence the grade concentration (fig 2).
The mapping established a complete picture and also helped to interpret thrust faults on either side of a clearly visible central fault that divided the main pit.
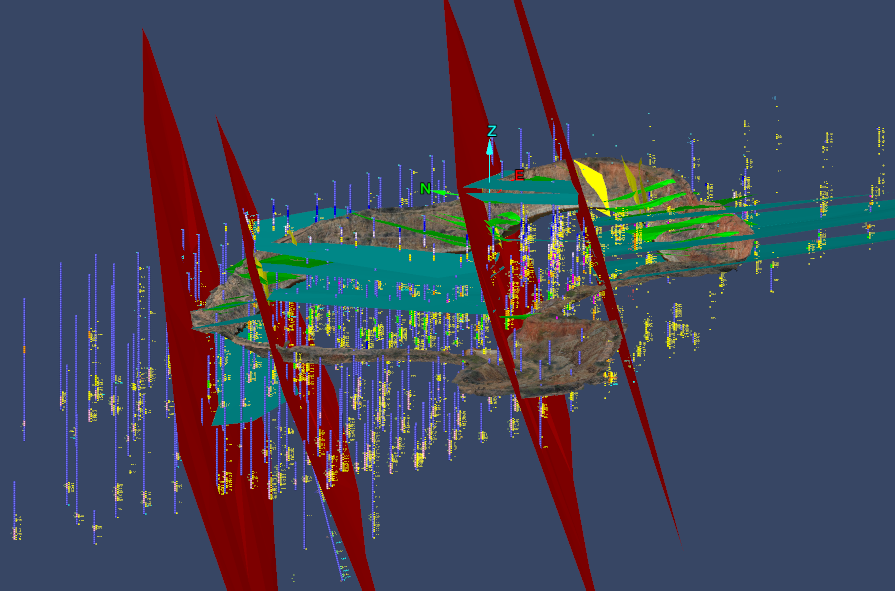
The next challenge was placing these major structures within the subsurface model. Visualising the grade trends using a DomainMCF model of the gold grade highlighted predicted patterns in the data.
The modelling accounted for inherent characteristics of the dataset, including uneven sample intervals, gaps in the data and potential contamination around existing workings. This allowed the placement of additional thrust and normal faults using recent televiewer data to assist in defining these structures (fig 3).
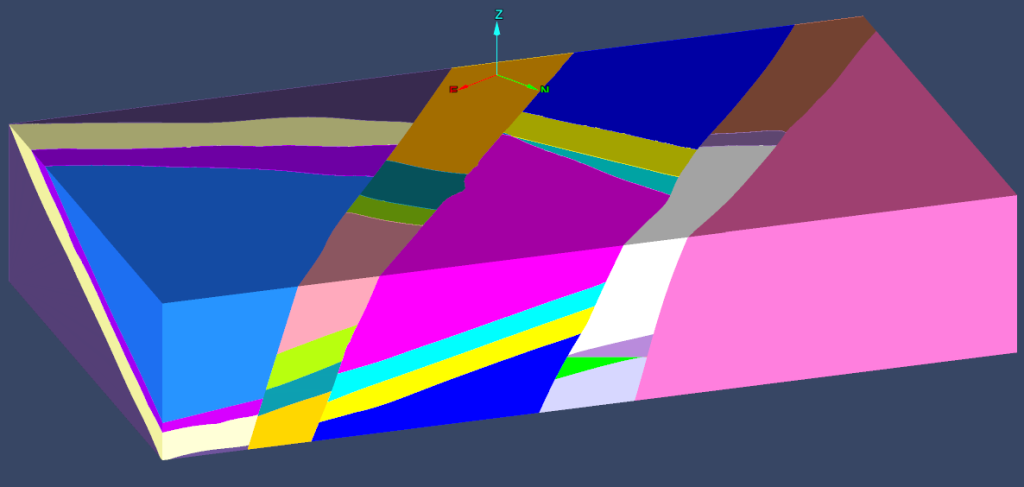
With thrust and normal faults in position, Burden switched to the new Fault Modeller tool in Vulcan GeologyCore to slice the model extents into different fault block domains.
The model area also includes a synclinal fold. Fault block domains and folding were written to drillholes and included as domain fields to influence the model trends. The final DomainMCF model was dramatically different to the original, showing how important it is to observe the structures.
Bonus evidence supporting the model inputs was sourced from regional studies that summarised the major deformation events.
Observing the structures present in the pit walls revealed the important events of the geological history.
Burden’s primary takeaway is to place value on what you see.
‘If you can first observe all the features and their relationships using all the available data sources, you are more likely to understand the controls to the complex picture in front of you,’ Burden concluded.
Ultimately, this holistic approach can save time and provide valuable insights for further assessments.
Burden plans to use the GMEK DomainMCF hours from her Geology Challenge win to continue to develop exciting new approaches to geotechnical modelling.
Thanks to Caroline Burden
Engineering Geologist, GMEK
- Mapping and observing the interplay of structures is an important aspect of modelling the geology of a complex gold deposit
- Machine learning application DomainMCF and new fault modelling tools were critical to the development of a realistic geological model
- New approach handled challenging dataset including uneven sample intervals, gaps in the data and potential contamination around previous workings