
June 2023 Issue Index
Geotechnical analysis tools
Maptek brings together the most comprehensive and powerful set of variogram analysis tools for geostatistical studies in Vulcan Data Analyser.
Integrating geological database analysis with other geological project work in Maptek Vulcan provides a single source of truth and avoids difficult, iterative spreadsheet approaches.
Custom domaining, flexible viewing and reporting ensures users can identify where data is deficient and communicate recommendations clearly with high impact visuals.
Using drillhole information to interpret the geotechnical data at the early stage of mining is a common practice in the industry. Most geotechnical drillhole information is thinly spread. A fast, routine solution is needed to calculate and interpret the statistical distribution for multiple geological conditions and mining scenarios.
This solution acknowledges the spread and general trend of the data, correlates and visualises the statistical distribution in the 3D CAD environment, and groups the data into several domains for further geotechnical analysis.
Vulcan Data Analyser assists geotechnical practitioners to perform statistical studies, with tools including general statistics, histograms, cumulative frequency plots, scatterplots, probability plots and quantile-quantile plots.
This enables users to explore and understand the data distribution and confidently estimate geotechnical parameters for further analysis.
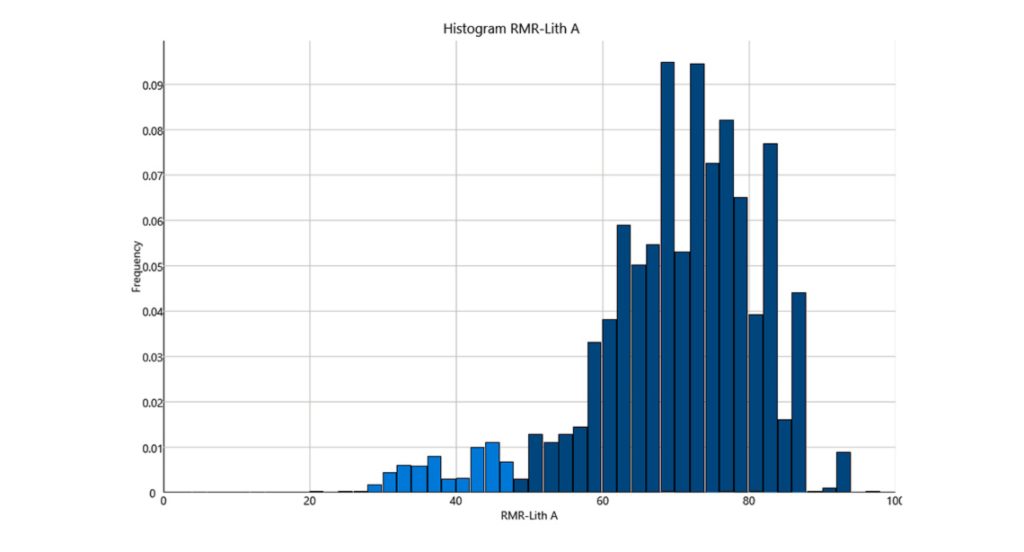
A histogram of the Rock Mass rating (RMR) for a particular lithology indicates that the data has a noticeable tail-left-skewed distribution toward Poor-Fair RMR (Figure 1). Further data refinement is conducted to investigate the potential of two principal data distributions within a lithology unit.

Using Vulcan Data Analyser to investigate the spatial location of the Poor-Fair RMR shows that the Poor-Fair RMR does not form a prominent cluster that may indicate a separate geotechnical domain, and the tail likely represents the variation within the rock mass (Figures 2 & 3). Other general statistics calculations enable users to assign the appropriate RMR value for the domain.

Vulcan Data Analyser speeds up the interpretation of geotechnical data to assist all stakeholders (geotechnical engineers, mining engineers and project managers) in evaluating different mining scenarios to meet tight project delivery frameworks.
Vulcan Data Analyser drives a better understanding of geological and analytical data, with a streamlined variogram analysis workflow.
Vulcan Data Analyser is available in the Analyse menu of the Vulcan GeoStatModeller bundle.
- Integrating geostatistical analysis with geological project work provides teams with a single source of truth to review data and communicate decisions clearly
- Vulcan Data Analyser contains all the necessary tools to explore and understand data distribution, and confidently estimate geotechnical parameters
- Fast iteration with inbuilt ‘trial and error’ tools allows geotechnical engineers and geologists to easily create and test multiple alternatives
Benefits
Advanced analysis – better understand technical data with statistical, graphing and display options
Fast iterations – easily create and test multiple alternatives aided by tools that speed up trial and error in determining parameters
Clear comparisons – display multiple models concurrently for real-time, side-by-side comparisons, impossible with spreadsheets
Customisable output – produce high quality charts and export to .png and .csv file formats for resource reporting