March 2018 Issue Index
New tools for resource geologists
Being able to analyse and interpret all available geological data within a single 3D visualisation environment streamlines resource modelling.
The upcoming Version 11 of Maptek Vulcan will allow resource geologists to take advantage of the single 3D visualisation environment on the Maptek Workbench for analysing and interpreting all available geological data.
The comprehensive range of statistical approaches supports intuitive interpretation, streamlined comparison of multiple theories and reliable results.
Maptek will deliver new geostatistical functionality in Vulcan 11 on the Workbench during 2018.
The Workbench is a dynamic architectural backbone that allows enhanced workflows and data sharing. Ultimately, all Maptek applications will be accessed and run from the Workbench.
The planned release adds new functionality to both the Vulcan Data Analyser (VDA) and grade estimation workflow with the introduction of Kriging Neighbourhood Analysis (KNA) within Vulcan GeoStatModeller.
Other functionality of interest to resource geologists includes enhancements to stratigraphic modelling, new options in estimation and simulation tools, and application of command list and scripting to automate the geological workflow and save time.
Kriging capability
Kriging Neighbourhood Analysis is a new feature. Fully integrated into the Vulcan grade estimation process, KNA is fast and intuitive to set up and run, and charts are readily saved for reporting.
KNA provides the ability to determine and optimise input parameters for the kriging process to minimise conditional biases during estimation. Block size, minimum and maximum numbers of samples, search distances and discretisation parameters can be charted showing their impact on kriging efficiency and slope of regression.
KNA can be effected on a single block (local) basis and on a multiple block (global) basis. The optimised KNA settings can be fed directly into a grade estimation run for efficient processing.
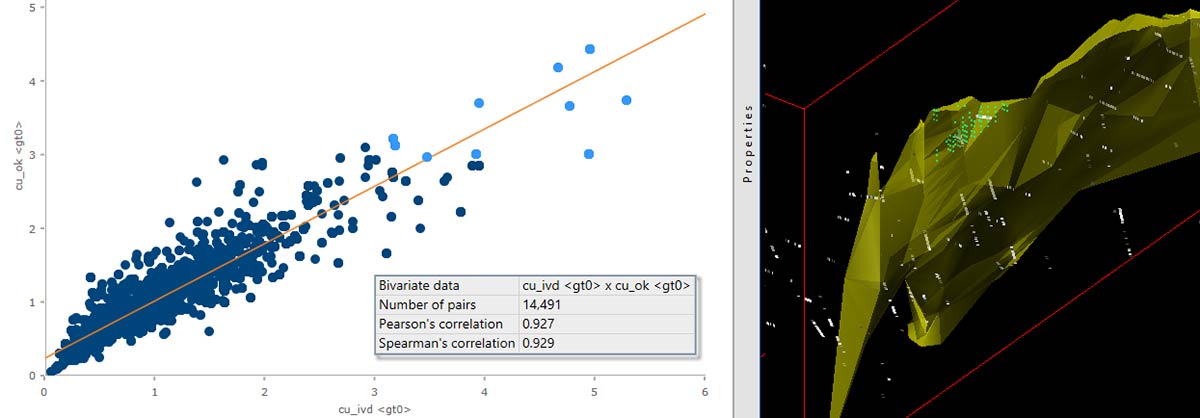
Vulcan data analyser
VDA is easy to use and is fully integrated with geological resource data. Major improvements to the user experience are backed up with new options for analysis.
Variogram generation for block model variables will supplement the existing capability from database variables. New deferred scatter plot and madogram charts will be available for validation of Gaussian simulations.
Data highlighting is a streamlined way to check spatial locations of chart outliers and assess their potential impact during resource estimation. Users can simply select data on an existing histogram, cumulative frequency chart or scatter plot and highlight the selected data in 3D.
Minor changes include general improvements to workflow for fan variograms, the addition of slider bars to dynamically adjust lag on variograms, updates to variogram modelling and many visualisation enhancements.