September 2020 Issue Index
2020 vision for the future
With almost four decades of commitment to technology research and development, Maptek continues to deliver practical solutions that add value to mining operations.
Desktop tools that enable mining professionals to interact with their data are the building blocks of Maptek solutions.
Today’s focus is on technologies that help acquire, manage and process data efficiently to generate value. This translates into integrated, specialised tool sets for applications across the mining life cycle as well as productivity gains to the mining business as a whole.
Maptek 2020 software releases deliver increased efficiency and confidence around assessing multiple scenarios, enabling informed evaluation of the effects of different variables on a geological model, mine plan or schedule.
Digital processes and increased automation are key enablers for success in the current economic climate. Interoperability between applications ensures access to functionality that represents the most effective, integrated approach to tackling a problem.
Centralised data plays a fundamental role in connecting information to find the ‘signal within the noise’. The digital approach allows hidden data relationships to be identified and exploited to refine resource models and mine plans.
‘We’re excited to help customers transition to our 2020 releases, and we can all look forward to further developments on the Maptek technology solutions roadmap,’ said Jesse Oldham, Group Product Manager Mine Planning.
Hear from Jesse Oldham about ways Vulcan supports confident decisions.
New and enhanced features in BlastLogic, Vulcan, Eureka and PointStudio are available now, with Evolution 2020 to follow, and we value your feedback.
Optimised infill drilling
Vulcan Drillhole Optimiser helps exploration projects, open pit and underground operations to confidently develop infill drilling plans that maximise resource recovery.
With Drillhole Optimiser, geologists can accurately assess multiple scenarios and budgets taking into account existing drilling and resource classifications.
The tool uses an intelligent randomised search algorithm to test multiple configurations that meet site constraints.
Inputs include: drillhole locations; block models flagged with areas of interest and recoverable ore by block; and potential drill pad locations, drill rig constraints and available drilling budget. Optimisation handles regular and sub-blocked models.
Operations see tangible results in greater orebody confidence, fewer wasted drillholes and improved cost-effectiveness.
Watch the video: Introducing Vulcan Drillhole Optimiser
Dynamic pit design
Dynamic pit design is the focus of the Automated Pit Designer enhanced in Vulcan 2020. The dramatically improved pit design process reduces the time for engineers to proceed from pit optimisation outputs to an actual pit design complete with ramps.
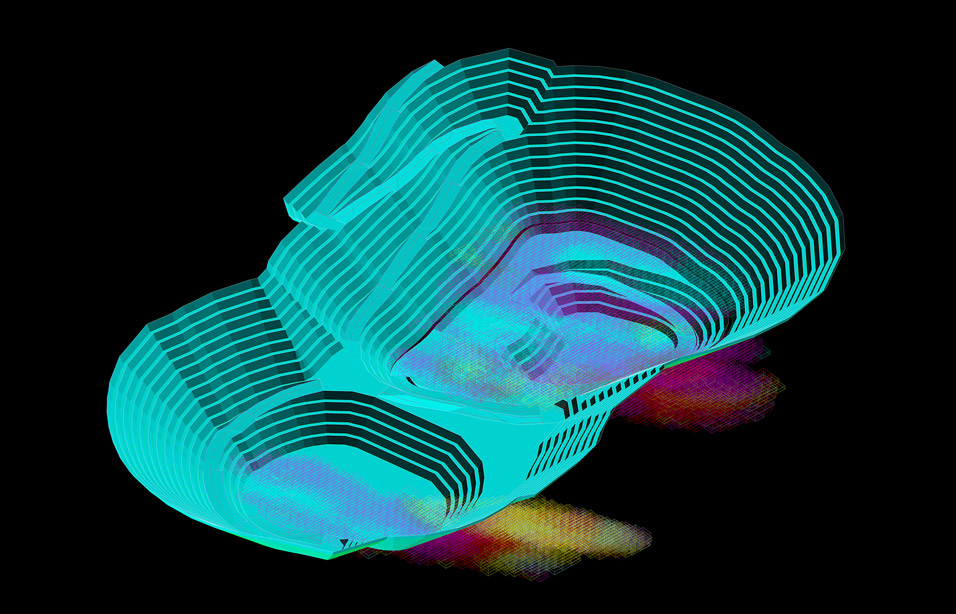
The ability to dynamically move pit walls on-the-fly and have all of the associated strings and data structures move in tandem is exciting. Engineers can move a pit wall and morph the associated benches above. Ramp insertion is supremely dynamic.
Automated Pit Designer avoids common pitfalls such as bizarre shapes occurring as a result of sharp edges. The streamlined setup process allows users to select block model variables with phases or pit numbers for interactive contouring.
Upcoming addition of automatic generation of pit solids as well as surfaces, and reserving on-the-fly will complete a dynamic engineering process that reduces manual work and results in optimal pit designs.
Watch the video: Tips and Tricks – Automated pit design
Analysing fragmentation
Better understanding of fragmentation can account for impressive downstream cost efficiency in excavation and haulage, crushing and processing.
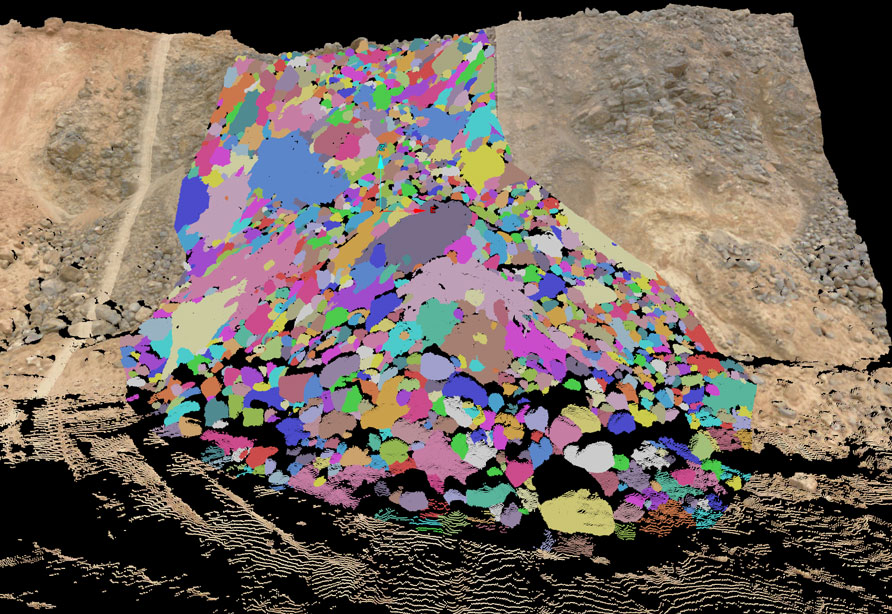
PointStudio Fragmentation Analysis allows KPIs to be achieved consistently. The new tool allows blast engineers and surveyors to quickly assess the condition of blasted rock, ideally before the material heads to the crusher.
Fragmentation analysis on 3D data is considerably more powerful and intuitive than methods that rely on analysing imagery. The digital output can be used to compare actual to predictive fragmentation in the BlastLogic drill & blast system.
A visual representation provides a way for material outside of specification to be identified and dealt with before reaching the plant. A unique feature allows editing of rocks or fines in the 3D view to characterise any that are not correctly defined.
Individual rocks can now be modelled from scanning of muck piles and draw points to provide accurate fragmentation S-curves from blasting or caving operations.
Fragmentation Analysis is available as an add-on to PointStudio 2020.
Watch the video: Introducing PointStudio Fragmentation Analysis
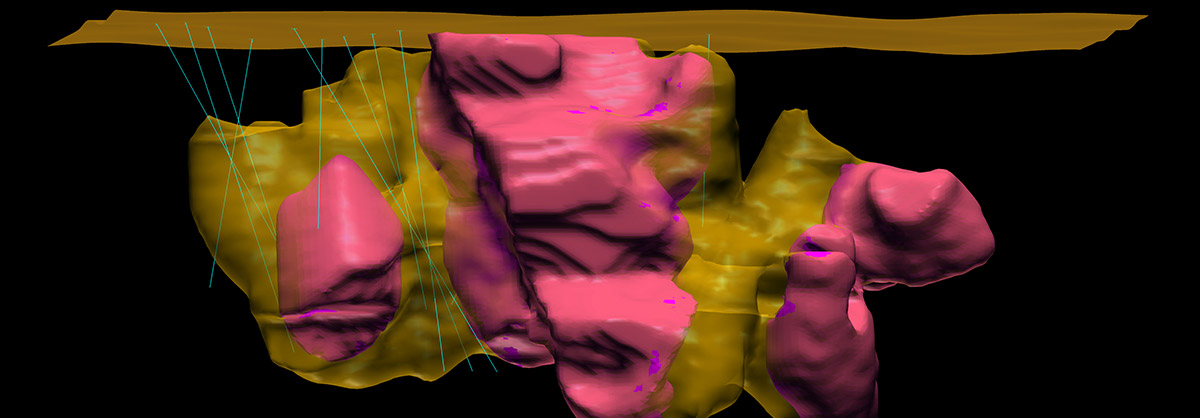
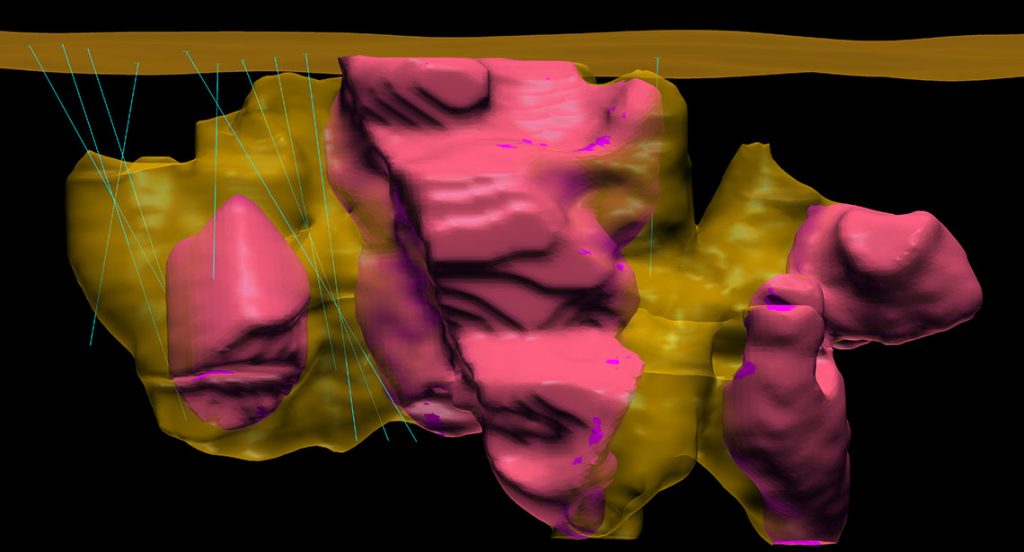
Measurement While Drilling
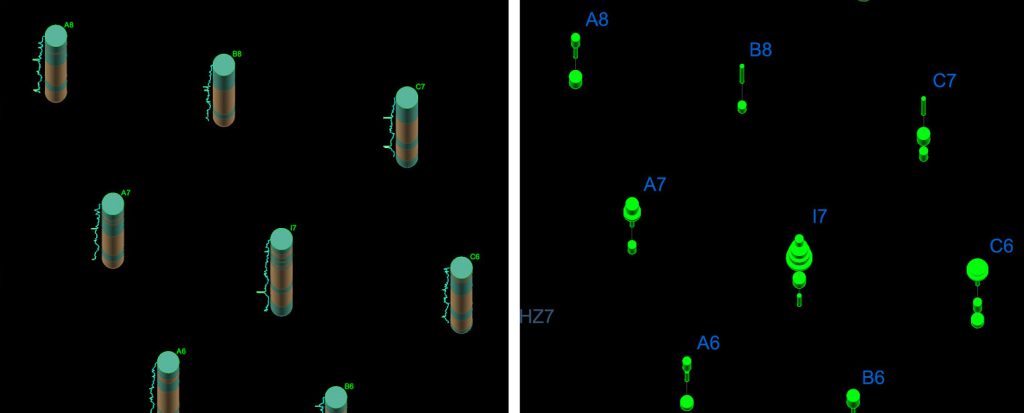
Bringing downhole drilling data to life enhances geological modelling and improves drill & blast outcomes. Matching blast design to validated geology allows accurate charge placement, which provides more uniform fragmentation.
BlastLogic provides a direct interface to drill navigation data and allows users to validate and associate the as-drilled information to design holes. Raw Measurement While Drilling (MWD) data is noisy by nature, and using the as-drilled data has often been overlooked.
Streamlining data interoperability between BlastLogic and Eureka is important in the dynamic mining environment where holes are loaded within hours of drilling. Geologists use Eureka to visualise downhole geophysical data and automatically assign lithology boundaries based on changes in the geophysical properties.
Intervals created in BlastLogic are passed through to Eureka together with the MWD data. Eureka interprets and updates the intervals. Validated data is brought back into BlastLogic and the charge plan and timing design can be automatically updated using the latest geology.
Better geological understanding helps mitigate potential dilution and leads to improved safety.
Watch the video: Introducing – Enhanced interoperability for downhole data
Vein modelling
The nature of narrow vein deposits has traditionally made modelling a challenge. Veins can be extremely thin and extend in any orientation from horizontal to vertical and may exhibit faults, folds and overturns.
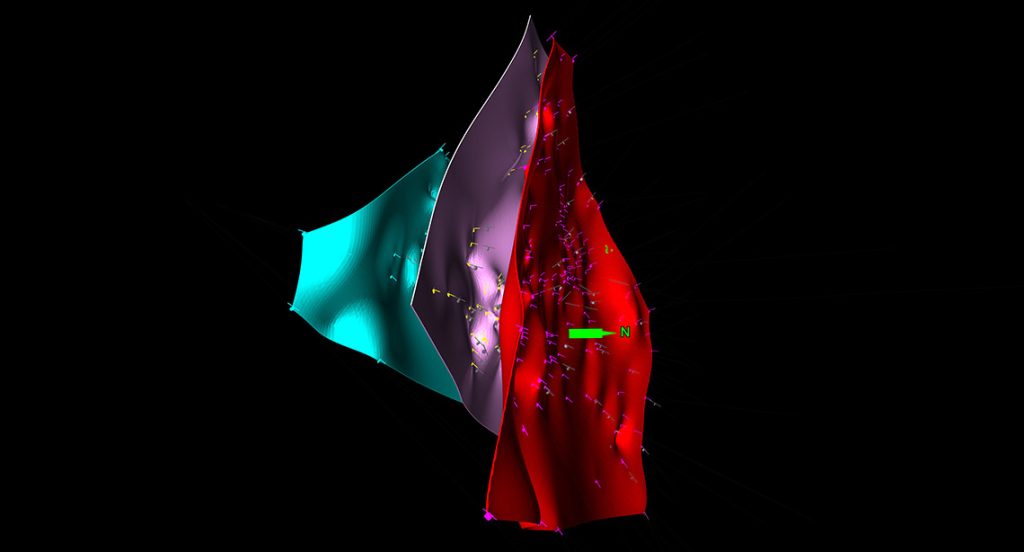
Enhancements to Eureka make it easy to rapidly build valid vein solids that can be used in block models for mine planning and reserving.
The approach builds on existing implicit model functionality to create hanging wall and footwall surfaces from drillhole and CAD data. Eureka automatically determines the best plane for modelling. Data selection and editing tools dynamically change the correlations and values before remodelling.
Eureka can handle less than ideal real world data, modelling with CAD data only, and single or multiple drillhole databases as inputs. Roof or hanging wall imagery from face mapping can be incorporated in the process. Solids can be created based on the hanging or footwall surfaces within a defined extent.
Hundreds of thousands of points can be modelled in minutes. The Radial Basis Function engine can read samples that start, end or are the hole. An iterative approach allows geologists to continuously refine their vein model until they are satisfied with the interpretation.
Watch the video: Tips and Tricks – Rapid vein modelling
- Maptek 2020 releases deliver dynamic, accurate modelling and engineering processes which boost customer confidence and efficiency
- Digital processes and increased automation are key enablers for success in the current economic climate
- Tangible benefits are realised through centralised data, interoperability, dynamic visualisation, optimised mine designs, reliable plans and conformant operations