March 2022 Issue Index
Dashboard delivers on data analytics
A coal mine in Queensland uses dynamic dashboards to display the latest drill and blast information to better inform planning, designs and scheduling.
Maptek mining technology expertise and industry partnerships have helped BMA Caval Ridge gain greater visibility around drill and blast across the operation.
The coal mine in Queensland’s Bowen Basin is part of the 50:50 joint venture between BHP and Mitsubishi Development. BMA Caval Ridge achieved record annual production of 8.7Mt in FY2020.
Having used Maptek BlastLogic quality management system for more than 4 years, BMA was seeking to improve drill and blast processes at Caval Ridge.
MEC Mining Senior Mining Consultant Mark Killip identified a gap in data communication, and approached Maptek to create dynamic dashboards to display up-to-date drill and blast information in an easy to understand format.
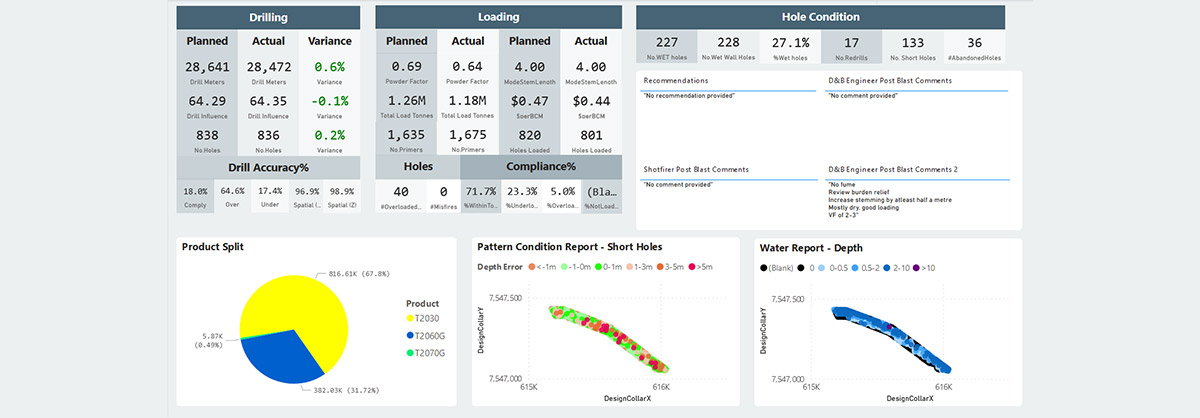
The dashboard reporting solution is a one-stop-shop for all BlastLogic field data reconciliations, reports and comparisons with design, enabling the mine to drive operational and engineering improvements based on past learnings.
Engineers, shotfirers and crew capture drill and blast information in the field using the BlastLogic Tablet.
Maptek worked with MEC Mining and Insight to ensure the right information was fed automatically from BlastLogic into a Microsoft Power BI dashboard. This provides engineers with a platform to learn from past blasts and improve planning, design and scheduling.
The alternative method involves hours of searching through blast folders, which is generally not possible in fast-paced production environments.
‘The integrated and accessible data provides near-live information from the drill and blast teams, enabling superior decision making and leading to best quality blast outcomes,’ Killip said.
‘Maptek technology is seriously game changing.’
The solution is tailored to the site, serving the needs of engineers, operations crew and management. Contemporaneous Tablet field notes are displayed on the dashboard and extra comments can be added later.
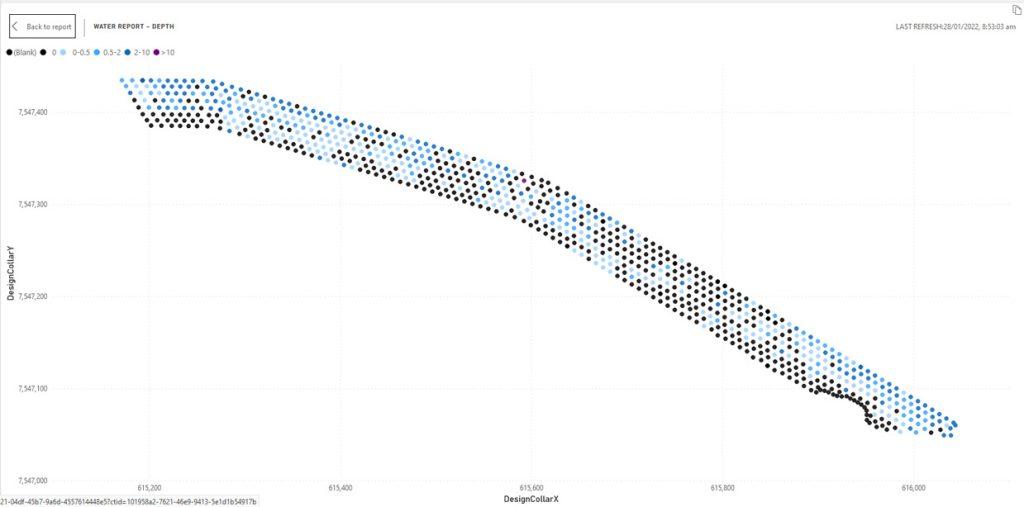
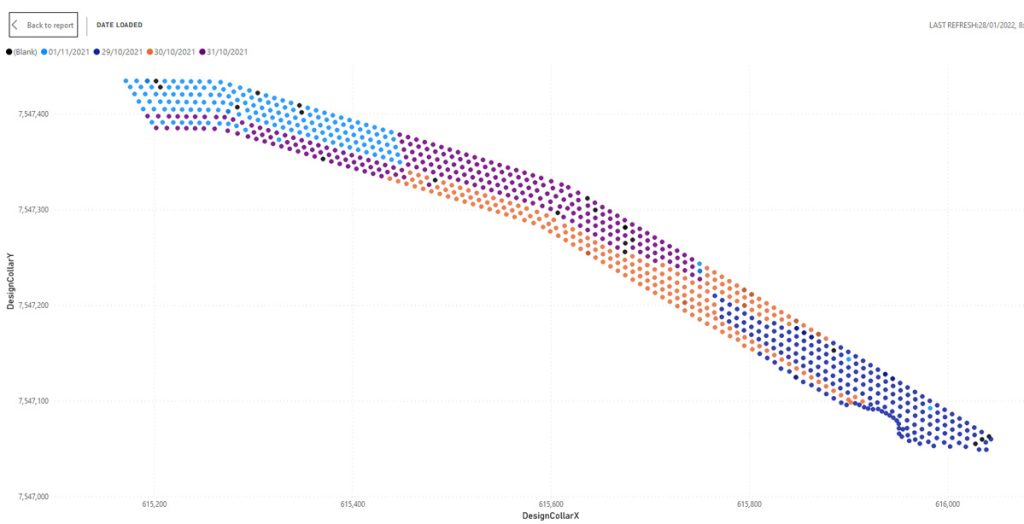
The dashboard was up and running within weeks. It delivers a design against actuals comparison for a wide range of blast metrics, with pie charts and spatial plots of holes coloured by dipping, backfilling, charging and wet hole information.
Leveraging BlastLogic’s SQL data warehouse provides access to years of information at the click of a button. This is otherwise archived on paper, and often stored off site. With Power BI the dashboard can be made available on all devices.
Insight specialises in harnessing the power of data to optimise operations in various industries, and immediately recognised there was a key requirement to bridge the gap between BHP and the logic behind the dashboard.
‘Insight and Maptek’s collaboration was a critical element in the overall success of the solution. Our technical consultants were able to leverage the industry specific drill and blast expertise of Maptek’s team to deploy an asset that provides valuable data that shortens the client’s time-to-insight,’ said Insight Data and AI Practice Lead, Haim Ozchakir.
The next challenge was to produce a sustainable solution that could be used by the entire organisation.
‘Visualising a dashboard is only one part of a very complex equation. The main challenge was building a solution that helps drive the business forward by providing meaningful insights to key stakeholders,’ Ozchakir added.
Strategic Account Manager at Insight, Michael Lewis believes the project has created an appetite to further explore the business impact of analytics, and Power BI in particular.
‘It’s about speed to data, time-to-insight, and being able to accurately plan the next step with more information, more variables, and in the context that the people on the mine site need,’ Lewis said.
‘Having access to timely information opens up opportunities for businesses to leverage machine learning and analytics to streamline and improve key operational processes.’
The Power BI dashboard solution has been well received. The next phase of the project will provide near-live information to operational crews to track the progress of drilling and loading activities, continuing to grow value from the investment in analytics.
Thanks to
BMA, MEC Mining and Insight
Mark Killip, Senior Mining Consultant MEC Mining, shares the benefits of Power BI and working with Maptek and Insight.

About MEC Mining
MEC Mining is a global technical consulting firm specialising in mining services capabilities across the project life cycle from early-stage exploration through development, mine planning, onsite management to mine closure and rehabilitation.
What is the greatest benefit of using Maptek technology?
Maptek technology is game changing. Their integrated and accessible data delivers near live information from the drill and blast teams, enabling superior decision-making and leading to best quality blast outcomes.
The addition of dashboard functionality further increases access to this data, allowing continuous improvement processes to occur efficiently and consistently.
What is the experience of the people using the Power BI dashboard?
Accessing the history of a blast area on a mine site is critical in building the latest and fullest information. But it can be a cumbersome and time-consuming process, with the very real likelihood of missing important information.
The PowerBI dashboard is a dream to use. It gives immediate, fingertip access to all historical blasting data. The capacity to scrutinise multiple blasts and cross reference for trends and outliers really enhances the user experience and enables the drill and blast engineers to fully focus their time and energy on delivering the highest quality blast designs.
How does it make people feel about their job?
Ask any drill and blast engineer what drives them, and they’ll universally agree that the most rewarding part of their work is creating best-scenario blast design and management for their customers. However, the essential but time-consuming preparation for this stage entails trawling through job packs, spreadsheets and manual blast lookups.
Maptek technology gives fast access to this information, allowing engineers to focus on the parts of the job that are more valuable to the customer and more enjoyable for them. This is where you want your drill and blast engineers to spend their time; fully armed with the data, they are motivated and ready to use their time delivering creative, cost-effective solutions.
Does the dashboard help operational and organisational goals?
Mine sites are awash with historical information but unless it is used productively it is merely clutter. The process of continuous improvement needs excellent data, easily accessed and in a format that adds value to drive sustainable progressive change.
The Power BI dashboard, with its rapid access capacity, has the potential to save hundreds of design hours a year while giving insight into every blast that has ever been documented on site. It enables engineers to easily spot patterns and identify trends.
Picking up one trend alone can add enormous value to the mining process through better blasting: this dashboard allows you to identify almost all of them.
What has it been like working with Maptek?
The Maptek team delivers the technology, and they are highly professional, passionate about mining and excel at what they do. Their collaborative approach means working with them is a pleasure.
Leveraging Maptek’s software expertise has enabled me to consistently deliver high quality drill and blast solutions to our mutual clients.
- A collaboration with BMA, MEC Mining and Insight has resulted in a one-stop-shop for all BlastLogic field data reconciliation, reporting and comparison with design
- The challenge with dashboards is to provide a solution that can be used by all stakeholders to guide decision making
- Timely information visible to all opens up opportunities for businesses to leverage machine learning and analytics to streamline and improve key operational processes